What Are Trapped Traders?
Trapped traders are participants stuck on the wrong side of a move with no good exit. They bought into what looked like a breakout, or they shorted a level that was "supposed to hold," and now the market is moving against them. Their only options are to take a loss or hold and hope.
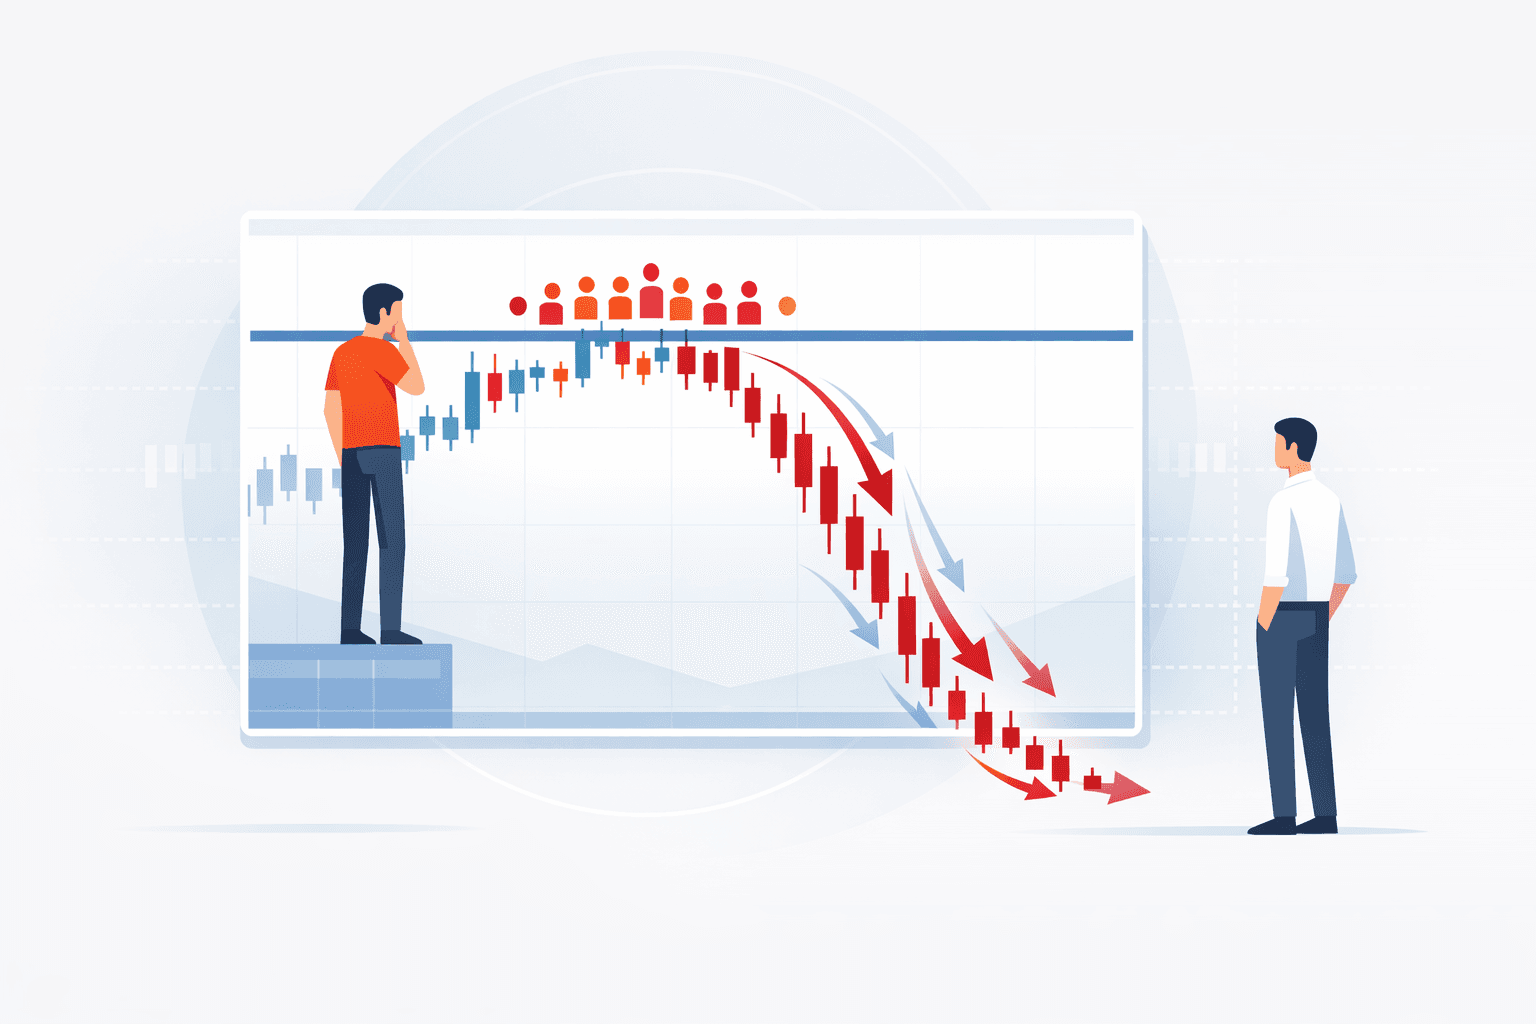
The critical insight: trapped traders' forced exits create the next move. When enough longs are underwater at the same level and the market drops further, their collective stop-outs produce a cascade of sell orders. That wave of forced liquidation is the sharp, impulsive move you see on the chart. It's not random. It's mechanical.
Trapped Longs vs. Trapped Shorts
Trapped longs bought near a resistance level expecting a breakout. Price rejected, reversed, and now they're holding losing long positions above the current market price. When they finally capitulate, their sell orders accelerate the move down.
Trapped shorts sold near a support level expecting a breakdown. Price bounced, squeezed higher, and now they're short below the market. When they cover, their buy orders fuel the move up.
The mechanics are mirror images, but the emotional response is identical: denial, bargaining, and eventually forced capitulation.

How to Spot Trapped Traders on a Chart
You don't need expensive order flow software to identify trapped traders. Four signals show up consistently on any futures chart, and they're the foundation of most price action trading strategies.
1. Failed Breakouts at Key Levels
Price pushes through a well-defined support or resistance level, holds for a few candles, then reverses sharply back through the level. Every trader who entered on that breakout is now trapped. The stronger the level and the more obvious the breakout, the more participants are caught.
This is why I watch for breakouts at obvious levels with a healthy dose of skepticism. A significant percentage of breakouts fail, and each failure traps a fresh group of traders whose exits fuel the reversal.
2. Volume Spikes Without Follow-Through
A candle prints heavy volume but price doesn't move proportionally. That's absorption. Buyers are stepping in aggressively (high volume), but sellers are matching them tick for tick (no price movement). One side is about to be very wrong.
When you see a volume spike at a key level followed by a reversal candle, the side that drove the volume is trapped.
3. Rejection Wicks and Engulfing Candles
Long wicks at support or resistance are visual proof of trapped traders. Price pushed to a level, traders entered, and the market immediately rejected. The wick IS the trap. An engulfing candle after a sustained move tells the same story on a larger scale.
4. Order Flow Divergence
If you do watch order flow, look for aggressive market orders (delta) pushing price in one direction while limit orders absorb them. When aggressive buyers are getting eaten by passive sellers, those buyers are walking into a trap. The divergence between aggression and price movement is the clearest real-time trapped traders indicator you'll find.
The Psychology of Being Trapped
You've read the last two sections to learn how to spot trapped traders on a chart. But if you've been trading for more than a few months, something in those descriptions probably felt familiar. Not because you've seen it on a chart. Because you've lived it.
Scroll through trading Twitter on any given day and you'll find it: the screenshot of a blown account, the "lessons learned" thread, the trader who averaged down into a short while ES ripped 40 points against them. It's the same story on repeat. The details change, the ticker changes, but the pattern is identical. And if you've traded long enough, you've been in that screenshot. Maybe you posted it. Maybe you just closed the app and sat in silence.
Why You Hold (It's Not Weak Discipline)
The disposition effect is a documented cognitive bias with a neurological basis, not a character flaw. When you're in a losing trade, your brain does three things:
Sunk cost anchoring. You've already lost $500. Your brain treats that as an investment to protect, not a cost to accept. "I can't close now, I'm already down too much" is your prefrontal cortex rationalizing what your amygdala demands: avoid realizing the loss.
Cortisol escalation. Kandasamy et al. (2014) found that chronic cortisol elevation from sustained losses increased risk aversion by a full standard deviation and reduced risk premiums by 44%. Translation: the longer you sit in a losing trade, the worse your decision-making gets. Your body is literally working against you.
Identity threat. Closing a losing trade means admitting you were wrong. For traders who tie their self-worth to their P&L, that admission feels like more than a loss. It feels like failure. So you hold, and you add, and you move your stop, because the alternative is confronting something harder than a red number.

This isn't about willpower. You can't willpower your way past a cortisol spike. You need a system that makes the right decision before your biology takes over.
The Real Trap: The Cycle, Not the Trade
A single trapped trade is a market event. It happens to everyone. What separates the trader who loses $400 once from the trader who loses $4,000 on the same pattern three times in a week is the cycle underneath.
The cycle works like this: you get trapped, you take the loss (eventually), you feel the sting, and instead of reviewing what happened, you take another trade to "make it back." That next trade is bigger, less planned, and driven by the emotional residue of the last one. When it also goes wrong, the cycle accelerates.
I've lived this cycle more times than I can count. The pattern is always the same: I get trapped in a position, I hold because the level is "right there," I add at a key level because my conviction spikes right when my judgment is worst, and then I watch my account bleed until the stop hits or the account blows. Every time I tell myself it's different. Every time it's the same.
If you're trading a prop firm evaluation, this cycle is even more brutal. You don't just lose money, you lose the entire account and start over. Industry estimates suggest only 5-10% of traders pass on their first attempt, and a huge chunk of those failures come from exactly this pattern: one trapped trade that spirals into a blown evaluation.
Sound familiar? I named this site The Trapped Trader because that cycle was my trading career for the better part of two years. Not because I didn't understand market structure. Because I understood it fine and still couldn't stop doing the same thing when my P&L was red.
The problem isn't the trade. It's the pattern. And if it keeps happening, it's not bad luck or bad markets. It's a cycle you can identify and interrupt, just like you'd identify trapped traders on a chart.
If you've caught yourself in the revenge trading cycle, you already know what this feels like. The fix isn't "just be more disciplined." The fix is building a system that removes the decision from the worst version of yourself.
How to Stop Being a Trapped Trader
Knowing what trapped traders look like on a chart is useful. Knowing that you ARE one is the part that actually changes your results. The gap between those two realizations is where most traders stay stuck for years.
Closing that gap takes structure, not motivation.
Define Your Exit Before the Entry
This is the single most effective change you can make. Before you enter any trade, write down the exact price where you're wrong. Not where the trade "might" recover. Where your thesis is invalidated.
If you can't define that level, you don't have a trade. You have a guess.
Run the Pre-Execution Protocol
The Pre-Execution Protocol is a three-step check that runs before every entry: check your size, check your stop, and check your bias. It takes about 15 seconds. The point is the pause, not the checklist itself. That 15-second gap between impulse and execution is where you catch yourself about to repeat the cycle.
If your size is too big for the stop distance, the protocol catches it. If your stop is a round number instead of a structural level, the protocol catches it. If you're entering because you're angry about the last trade, the pause catches it.
Run the Trapped Trader Test
Before every trade, ask: "If this moves against me immediately, will I hold and hope, or will I execute my stop?" If you can't honestly answer "execute," you're about to become the trapped trader on someone else's chart. And if you catch yourself never taking the trade because you're afraid of the answer, that's the opposite trap: analysis paralysis disguised as discipline. The test exists to make sure you're trading with a plan, not to keep you on the sidelines.
Journal the Pattern, Not Just the Trade
Most trading journals log entries, exits, and P&L. That's accounting, not self-awareness. The pattern that traps you lives in the space between trades: what you were feeling, what you told yourself, and what made you click the button despite knowing better.
Track the emotional sequence, not just the ticker. Over 10-20 trades, the pattern becomes obvious. If you want a structured approach to this, the lesson on building your journal into a real performance tool covers emotion tracking and pattern detection in detail.

Let the Drawdown Protocol Catch What You Miss
The Drawdown Protocol is the safety net for the days when the Pre-Execution Protocol isn't enough. When you've hit 50% of your daily risk budget, you cut your size in half. When you've hit 100%, you're done for the day.
No negotiation. No "one more trade." The protocol exists because the version of you that's down on the day is the version most likely to get trapped, and that version doesn't get a vote on position size.
Your position sizing framework and your drawdown rules work together. Size keeps individual trades manageable. The protocol keeps losing days from becoming losing weeks.